Sunday, 28 May 2023

Hidden Markov Model ( HMM )

 Unraveling the Enigma: Exploring the Hidden  Markov Model


Introduction

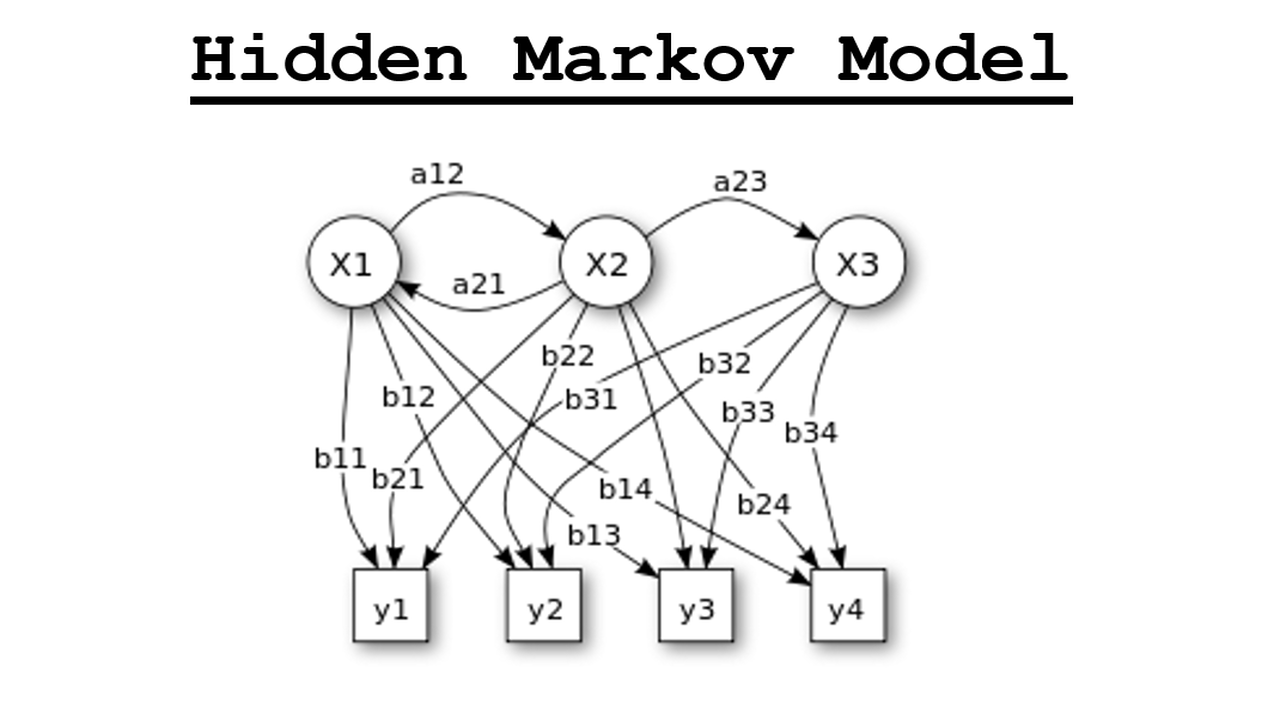
Hidden Markov Model is a probabilistic statistical model in machine learning which is used to describe the probability between a sequence of hidden and observed states. It is mainly used for prediction and classification.    


Fig 1: Hidden Markov Model


Terminology Decoded

Model:

It is a machine learning model that uses a dataset as its training dataset. A model's primary function in machine learning is to do a desired task by taking a dataset as a reference and preparing it as a ready-to-use algorithm so that when subsequent datasets are used, it will produce the proper output that it learned using the training dataset. A model might include several algorithms and employs the concept of learning. A model is employed for this purpose.

Hidden States:

Hidden states are variables that are unobservable( unmeasurable ) but are inferred or calculated based on observed data.

Observed States:

Observed states are variables that store the characteristics that are present in that dataset and may be directly measured. The observed states have an impact on the hidden states. 


Fig 2: Hidden States and Observation States


Transition Probability:

The probability that tracks the transfer of hidden states from one to another in a dataset is known as transition probability. The observed states determine the probability (value) of a label in a dataset changing its hidden state from one to another. 

Emission Probability:

Emission probability is a metric that tracks the possibility of each hidden state producing a certain combination of visible states. It measures the likelihood (value) of viewing specific states by analyzing and comprehending the links between concealed and visible states.


Fig 3: Transition and Emission Probabilities


Explanation

  1. Labelled Dataset: First it begins with a labelled dataset in which each data point has an associated label. The HMM is trained using this dataset. This is also called as training data. The HMM examines the labelled dataset to determine the elements that impact or differentiate the labels. It seeks patterns and connections between the factors and the labels. 
  2. Observed States: Factors that can be measured or observed directly are saved as observed states. Variables that capture the important measurements or attributes of the data points are often used to represent these observed states.
  3. Hidden States: The observed states are utilized to figure out what the hidden states are. The underlying variables or phenomena that generate the seen data are represented by the hidden states. The labels or discrepancies between the labels in the dataset are caused by hidden states. They are not directly quantifiable and are saved using the label name or another representation.
  4. Transition Probability: The transition probabilities explain the possibility of a concealed state shifting to another. These probabilities capture the dynamics or transitions between hidden states in an observation sequence. They are determined by analyzing the labelled dataset.
  5. Emission Probability: Given a concealed state, the emission probabilities describe the likelihood of witnessing specific outputs or measurements. They represent the link between the concealed and observable states. These probabilities are also calculated using the labelled dataset analysis. Here measurements or observed data are outputs. 
  6. Model Set-up: Once the transition and emission probabilities are calculated, a model is built around them. The training data is used by the HMM to learn the patterns and correlations between the hidden and seen states. This trained model can then be used to predict and classify new, previously unseen data.


Algorithm for Hidden Markov Model

1) Define the observation space and the state space 

  • State Space: This is the set of all potential hidden states, which represent the system's underlying components or phenomena.
  • Observation Space: This is the set of all conceivable observations that can be measured or witnessed directly.

2) Define the Initial State Distribution

The initial state distribution aids in determining the HMM's starting point. It gives the model a probability distribution over the possible hidden states, allowing it to start its analysis from a specific state depending on the probabilities.

3) Define the State Transition Probabilities  

These probabilities describe the chances of transitioning from one hidden state to another. It forms a transition matrix that captures the probability of moving between states.

4) Define the Observation Probabilities

These probabilities describe the possibility of each observation being generated from each concealed state. It generates an emission matrix that describes the likelihood of generating each observation from each state. 

5) Train the Model

Algorithms such as Baum-Welch and forward-backward are used to estimate the parameters of state transition probabilities and observation likelihoods. These algorithms alter the parameters iteratively based on the observed data until they converge.

6) Decode the Sequence of Hidden States

The Viterbi algorithm is used to compute the most likely sequence of hidden states based on the observable data. This sequence can be used to anticipate future observations, classify sequences, or find data patterns.

7) Evaluate the Model

The accuracy, precision, recall, and F1 score of the HMM can all be used to evaluate its performance. These metrics assess how successfully the model predicts or categorizes data.


Example of Hidden Markov Model

1) Establish the observation and state spaces

  • State Space: Let's pretend we have three hidden states: "sunny," "cloudy," and "rainy." These are the many weather situations.
  • Observation Space: In our case, the observations are "umbrella" and "sunglasses." These are the observable signs that can be used to forecast the weather.

2) Define the Initial State Distribution

We define the initial state distribution, which at the start assigns probability to each concealed state. For example, we may have a better chance of starting with a "sunny" day rather than "cloudy" or "rainy."

3) Determine the Probabilities of State Transition

We calculate the chances of switching between concealed states. For example, switching from "sunny" to "cloudy" may be more likely than transitioning from "sunny" to "rainy" or vice versa. A transition matrix captures these probability.

Step 4: Define the Probabilities of Observation

Given a specified hidden state, we assign probabilities to each observation. For example, if the weather is "sunny," the likelihood of needing sunglasses is high, whereas the likelihood of needing an umbrella is low. These probabilities are used to generate an emission matrix.

Step 5: Develop the Model

The model learns the parameters of the state transition probabilities and observation probabilities using a training dataset of labelled weather observations. It iteratively modifies these settings using techniques such as Baum-Welch until they converge.

Step 6: Decode the Hidden State Sequence

Given a set of observations, such as "umbrella" and "sunglasses," the Viterbi algorithm determines the most likely sequence of hidden states. Based on the observed data, this sequence depicts the projected weather conditions.

Step 7: Assess the Model

Metrics such as accuracy can be used to evaluate the performance of the weather prediction model. This entails comparing anticipated weather states to actual weather states to determine how well the model predicts.


Fig 4: Example of Hidden Markov Model


Real Time Applications of Hidden Markov Model

  1. Music analysis
  2. Gesture learning in human-robot interface
  3. Speech recognition
  4. Natural language processing( NLP )  

Investigating the Person Behind the Blog

If you want to discover more about me and my experience, please visit click on the below link to go to About Me section. More information about my history, interests, and the aim of my site may be found there.

I'm happy to share more useful stuff with you in the future, so stay tuned! Please do not hesitate to contact me if you have any queries or would like to connect.


Thank you for your continued support and for being a part of this incredible blogging community!"


Thursday, 25 May 2023

Big Data Analytics

 Data Dive: Unraveling the Wonders and 

 Possibilities of Big Data


Introduction

Definition: 

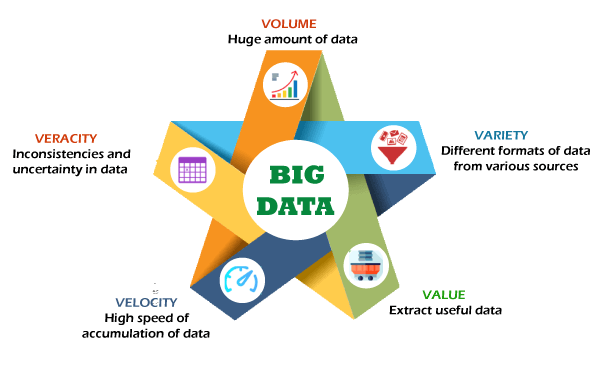
Big data is defined as data that contains an extraordinarily large volume of complicated and unstructured data that may be analyzed or managed. It can also be defined in other ways, such as large data being data with increased variety, increasing volume, and greater velocity. This is known as three Vs. 


Fig 1: Intro to Big Data 


Keywords:

Complex Data: Complex data is data that contains several variables as well as relationships between those variables. In a nutshell, it is tough to comprehend.  

Volume: The term "volume" refers to the amount of data or rows present in the corresponding columns, which suggests that there is a large number of data or data entries under each data subject.

Velocity: The term "velocity" refers to the rate at which data grows, which indirectly signifies the time it takes for data to grow massively.  

Speed: The term "speed" refers to the amount of data, data entries, rows, or columns added to the data center that houses big data.

Unstructured Data: The term "Unstructured Data" refers to data that does not have a defined format and is available in a variety of formats, making it difficult to grasp because they are all in different formats.

History of big Data:

According to US Government reports from 1880. It was the first census program in the United States. The census program created a massive amount of data, which was deemed raw data collected from citizens. According to reports, analyzing or studying census data would take roughly 8 years, necessitating the use of big data. Even after that, in the twentieth century, data began to grow rapidly, making management difficult. Finally, in 1965, the first data center was created with the intention of storing millions of records.  


Fig 2: History of Big Data


Example of Big Data:

Customer Acquisition and Retention:

In business, big data is commonly used. Any firm is entirely dependent on its clients. Customers are their primary source of income. As a result, it is critical for them to understand their customers' needs. So big data is employed in such a way that it collects or retains all data such as client details, products purchased, and recommended products. Because this is a massive volume of data, it qualifies as big data. The data is then analyzed using big data analytics, and various patterns of customers are searched, such as what all products a customer bought or was looking for, when he bought, in which month which product was searched more or bought more is the season's most popular product. As a result, the business can be improved, which equals more things sold. This type is used in Coca Cola Company.

Advertising Solutions and Marketing Insights:

In this case, big data is employed in advertising in such a way that client information and other facts are maintained in a database. Then, utilizing big data analytics, we match the customer's details with their requirements and make additional recommendations. In summary, big data analytics is used to analyze consumer data, after which customer behaviour is analyzed and recommendations are created. Currently, Netflix company employs big data analytics in this manner.  

Risk Management:

Risk management is the process of analyzing potential losses from corporate investments and devising proactive strategies to handle them. As many firms or companies make several investments each day, big data is employed in risk management. This is the revenue created by that company. They make a profit as well as a loss. So, utilizing big data analytics, we may examine data including numerous bank investments. Big data gives various methods for analyzing risk situations, which means that the likelihood of loss can be analyzed and an expected amount of loss projected, using which the organization can be warned and look for solutions to mitigate this loss. In this way, big data aids risk management. Risk management is the process of analyzing the amount of loss that could come from a business investment before it occurs and finding for a solution to it. However, in general, risk management in a firm entails managing or projecting a company's investment loss. The methods described above are how big data is used in risk management. UOB (United Overseas Bank Limited) in Singapore, for example, employs big data tools. It uses the term "value at risk" to describe the amount of potential losses that can result from an investment.  This is known as a risk management system. 

Innovations and Product Management:

Using big data, several companies can generate new products or innovate. Big data would assist businesses in doing so by generating massive amounts of data containing customer input, market trends, and competition actions. We can analyze this enormous data using big data analytics, and this will enable us to know how far back the company is in the market and how they should enhance their products, or what all new products can be made that are uncommon and in demand, as this will increase their sales. Amazon Fresh is a perfect example of using big data in innovations. 

Supply Chain Management:

Predict Demand: Big data analysis can help organizations detect patterns and trends in client demand, allowing them to more correctly forecast future demand. Increase Efficiency: Companies can utilize big data to track and analyze numerous parts of their supply chain, such as transportation routes, warehouse operations, and supplier performance.

Enhance Visibility: Big data enables real-time visibility into supply chain activities. Companies can monitor inventory levels, trace the movement of items, and obtain visibility into various phases of the supply chain.

Reduce Risks: Big data analysis aids in the identification of potential supply chain risks and interruptions. Companies can proactively plan for eventualities, manage risks, and maintain supply chain continuity by analyzing data on weather trends, geopolitical events, or supplier reliability.


Types of Big Data:

Structured Data:

Structured data is a type of large data in which all of the data is stored, accessed or processed  in a single format that is familiar to us and straight forward to analyze.

Unstructured Data:

Unstructured data is a sort of large data in which the full data set is stored, accessed, or processed in many formats, making analysis and comprehension difficult. 

Semi Structured Data:

Semi structured data is a sort of big data which contains both structured data as well as unstructured data as a part of the entire data present. It may seem to be structured but it is not perfectly structured such as the format RDBMS ( Relational Database Management System ). 


Fig 3: Types of Big Data


Characteristics of Big Data:

  1. Volume
  2. Velocity
  3. Variety

Fig 4: Characteristics of Big Data


Meticulous  Observations:

  1. The velocity of large data is proportional to the amount of memory needed to store the big data.
  2. Variety in big data indicates that the data is available in a variety of formats, including audio, video, and text. 


Benefits of Big Data:

The benefit of big data is that it aids in the analysis and comprehension of a large amount of data, which would be a tough or demanding work for a person, particularly in enterprises or businesses where a large amount of data is collected and its volume is steadily increasing.  


Working of Big Data

Integration:

Big data works by first collecting data in several formats and then converting all of the data into whichever format is most convenient. Then, all of the data available is attempted to integrate, which means blend. It can be integrated utilizing ETL (Extract, load, and transform), however it is insufficient to convert such a large amount of data. As a result, big data integration is completed first. 

Manage:

Then, some storage locations are used to manage big data. Following integration, all data is kept in the cloud or a data center. It is stored in the data center, and it can be accessed from there. This is an important method of managing massive data. 

Analyze:

After big data is managed or kept, big data analysis begins, implying that the data is meticulously scrutinized. The goal of this stage is to ensure the following: 

  1. Better understanding of the data 
  2. Understanding or discovering pattern trends in data for prediction
  3. Extracting insights from the data ( same as point 1 as better understanding of the data would help to gain information or extract information from the data ). 


Fig 5: Working of Big Data


Challenges of Big Data

Quick Data Growth:

When it comes to big data, the rate of expansion can become so rapid that it becomes challenging to manage and analyze.

Storage:

When the volume of large data increases, it becomes harder to store it because all storage has a maximum size or limit.  

Syncing across Data Sources:

When a large amount of data is present in several forms, the problem that occurs is that one data in one format after being imported may not be up to date when compared to other data in different formats. 

Security:

When a vast volume of data is present, such as in a major firm, the data may contain valuable information that is at risk of being stolen, causing an issue for the organization.

Unreliable Data:

When such a big amount of data is present, the data may begin to contain inaccuracies as a result of the large number. Another possibility is that when such a big amount of data is present, we cannot remove the errors and outliers, which is an issue, and as a result, we cannot claim that the data is 100% correct.


Fig 6: Challenges faced by Big Data


Real Time Applications of Big Data


Big Data in Product Development:

Analyzing Customer Behaviour:

The initial stage in product development would be to take the customer's data and analyze his previous and search products to gain an understanding of the customer's conduct. Customer behaviour refers to the product they purchased and are interested in. This would allow us to better understand demand and where we could enhance sales.

 Limitation:

The key issue that occurs in this step is that in order to understand the customer's behaviour, we need more data, which leads to an increase in volume data based on his search history. This would create a storage problem.

Analyzing high volume of Data Formats:

Companies must first collect data and then attempt to transform the data into a single format so that data analysis is not difficult. As a result, we would combine the data. 

Limitation:

The problem that comes after integrating all of the data is that after converting all of the data into a single format, everything is mixed, making it harder to distinguish between distinct data present, therefore path analysis is required once more. As a result, we'd have more time. 

Improving Customer Experience:

Big data refers to the accumulation of massive amounts of data gathered from various social media sites such as Instagram, customer feedback, and other platforms. This would allow us to learn about the interactions between customers and products, as well as the customer experience. We can deliver personalized gifts or discounts to customers depending on their conduct or experience by analyzing their behaviour or experience. This is done to keep the consumer safe. Overall, customer chunk may be regulated using this information.

Limitation:

A sophisticated model must be constructed using machine learning techniques to anticipate the customer's future actions based on the data provided. 

The In Store Shopping Experience:

The corporation or business should also seek for ways to analyze geographical conditions in order to provide a pleasant in-store experience and try to provide all kinds of facilities in order to make the consumer comfortable. In addition, the corporation could consider additional solutions, such as a mobile app or website, which would simplify the customer's work and attract new customers.

Limitation:

As different consumers have different opinions, a vast amount of data would be collected in order to determine the majority of customer input or their opinion on this subject. 

Pricing Analytics and Optimization:

Retailers and business owners should consider and analyze pricing and other factors in order to maximize profits. Pricing must be studied in relation to customer feedback, rival pricing, and market value before deciding on a price that will generate a decent profit for the organization. As a result, big data analytics must be used to analyze consumer feedback, current sales, rival pricing, and market value. 

Limitation:

To perform pricing analytics, we need to have millions of transaction records saved in a database. 


Fig 7: Product Development using Big Data


Wednesday, 24 May 2023

Machine Learning

Machine Learning in AI

Aim of this Blog: 

This blog was created to offer knowledge on machine learning algorithms in an easy-to-understand manner. 

History: 

Alan Turing created the Turing Test in 1950, which became the litmus test for determining whether machines were "intelligent" or "unintelligent." The requirement for a machine to be classified as "intelligent" was that it be able to persuade a human that it, too, was a person. Soon after, a Dartmouth College summer research program became the acknowledged genesis of AI. The Turing test was a test in which two groups were formed in a room, one with a computer and the other with people sitting. Now, the computer was designed to converse with humans, and the computer would be approved or given the status of "intelligent" if the human believes the computer is a human. If he believes the other is a human, the computer is set to ''intelligent." If a human can figure out that the other is a computer, then the computer is not ''unintelligent." 

From this time forward, "intelligent" machine learning algorithms and computer programme began to arise, capable of performing tasks ranging from organizing salespeople's travel routes to playing board games with humans such as checkers and tic-tac-toe.


   fig 1: History of Machine Learning

Introduction: 

Machine Learning is a subsection of Artificial Intelligence (AI) that allows users to submit large amounts of data to computer algorithms, which may then be used to make data-driven recommendations and decisions based on the input provided. 

Fig 2: Machine Learning (ML)


Uses of Machine Learning:  

  1. Data driven recommendations
  2. Decisions

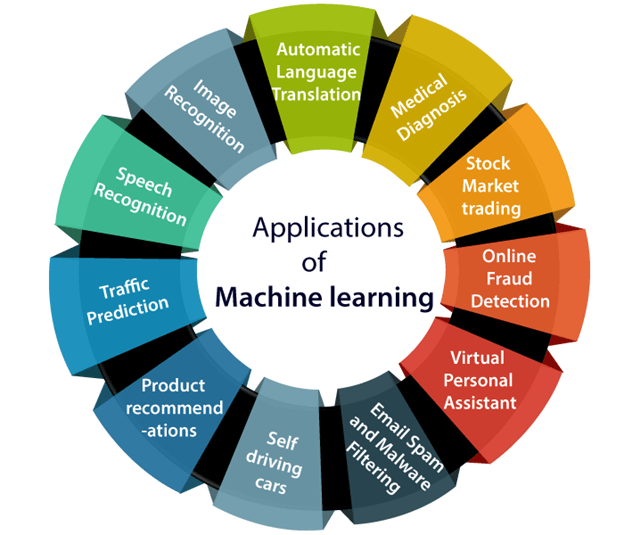
Applications of Machine Learning:

  1. Image Recognition
  2. Speech Recognition
  3. Google Maps
  4. Product recommendations
  5. Self Driving Cars
  6. Fraud Detection
  7. Virtual Personal Assistant


                                                       Fig 3: Applications of Machine Learning


Applications in Machine Learning Explanation:

Image Recognition:

Image recognition can benefit from machine learning. So we must feed the system a vast dataset of varied photographs of various people and then do image recognition using a machine learning method. The training dataset is provided as the data for recognition, followed by the input or input dataset. It stores the information present in trained dataset neutral network and then compared input with it using machine learning algorithm. Using the training dataset, the machine learning system matches the faces in both datasets and then outputs the results. 

Fig 4: Image Processing using Machine Learning 


Speech Recognition: 

Machine learning can help with speech recognition.  The way speech recognition works is that when a speech is recorded, it is translated into binary text. Then it is compared to see if the speech matches or not. Because machines can only interpret binary text, it gets transformed.  Binary text is a machine-readable language. 

Fig 5: Speech Recognition using Machine Learning


Google Maps:

  1. Direction and Routes: Google Maps routes use machine learning techniques to offer the fastest way between two points utilizing the concept of optimization. The concept of backtracking is used to obtain an optimized path.
  2. Traffic Prediction: Machine learning can anticipate traffic and warn the user about traffic conditions in any given place by using prior photographs and historical data. 
  3. Location Recommendations: Machine learning can provide geographical recommendations based on our search history or the topic we are viewing. 
  4. Local Business Information: Machine learning may also capture reviews, images, and information from local businesses in a given area and provide feedback and suggestions if they are required or considered relevant to their business. 

Fig 6: Google Maps using Machine Learning


Product Recommendations:

Machine Learning can also be utilized in product recommendations, where it uses search or order history data to predict and display recommended products based on the predictions. 

fig 7: Product Recommendations using machine learning


Self Driving Cars:


Fraud Detection: 

Machine learning may detect fraud by providing a training dataset, and then utilizing anomaly detection, aberrant observations are collected and noted as fraud and stored as knowledge, and then an input data or dataset is provided. Then, utilizing knowledge fraud detection, a dataset can be discovered. A trained dataset (example) is always used by the machine to gain expertise. 


Fig 8: Fraud Detection using Machine Learning


Virtual Personal Assistant:

Machine learning can be utilized in virtual personal assistants as well. When a person speaks, the assistant uses natural language processing (NLP) to translate the speech into text. The voice or speech of user is taken as input using a microphone. The algorithm is then provided input based on the text, and the algorithm conducts the command while also converting its text into speech and making the speech audible to the user, and this is how a virtual personal assistant works. 


Fig 9: Virtual Personal Assistant using Machine Learning


Conclusion:

Machine learning, a critical subfield of AI, is transforming industries. Its predictive capabilities analyse data, identify patterns, and detect financial fraud. It forecasts illness progression and recommends remedies in healthcare. Spam filtering, picture recognition, and language processing all benefit from classification problems. Marketing makes use of machine learning for targeted marketing and client segmentation. Predictive maintenance aids manufacturing, while cybersecurity detects dangers in real time. Fairness and accountability are ensured by ethical principles. With continual improvements, machine learning's potential to improve lives and drive innovation is boundless, transforming industries and enabling AI to make accurate predictions, classifications, and solve complicated issues.